Visualisation des données de santé : transformer les données de santé en informations exploitables

In a world where health systems generate massive volumes of data every day, making sense of it all is a growing challenge. That’s where health data visualization comes in. By transforming integrated and unified health data into intuitive visual formats (such as charts, dashboards, and maps) organizations can better understand complex information, uncover patterns, and make faster, more informed decisions.
What is health data visualization?
Health data visualization refers to the process of converting raw, structured health data into visual content that’s easier to read, analyze, and act upon. This includes a wide range of visual tools, from simple tables and graphs to complex interactive dashboards and animated infographics.
At Bluesquare, we support global health stakeholders in making data more accessible and impactful through innovative digital solutions. One key pillar of our work is enabling ministries of health, donors, and NGOs to visualize their data in ways that drive better governance and improved health outcomes.
Why does health data visualization matter?
Collecting health data is only the first step: without proper processing and presentation, raw data remains difficult to interpret. Data visualization bridges that gap by turning complex datasets into meaningful insights.
Accelerating decision-making
When decision-makers are faced with mountains of raw data, important insights can be lost in the noise. Visual tools bring clarity. By using dashboards and infographics, health professionals can quickly spot trends and anomalies, monitor program performance in real time, and track progress thanks to key health indicators. This enables faster and more evidence-based decisions at every level of the health system.
Empowering stakeholders
Whether it’s frontline health workers, government officials, or international donors, stakeholders need data they can easily understand and act on. Visualization makes complex datasets accessible to all, for instance by gaining better oversight of national and regional health initiatives. At Bluesquare, we develop visualization tools that cater to the unique needs of each audience.
Examples of health data visualization in action
Bluesquare products can create interactive dashboards, maps and infographics, enabling data to be visualized in the most effective and actionable format.
Interactive dashboards
Perhaps the most widely used tool in the field, interactive dashboards provide a dynamic way to explore data. These tools can present:
- Real-time data, such as vaccine stock levels or facility usage;
- Historical trends, such as disease incidence over months or years;
- Key performance indicators, aligned with national health strategies.
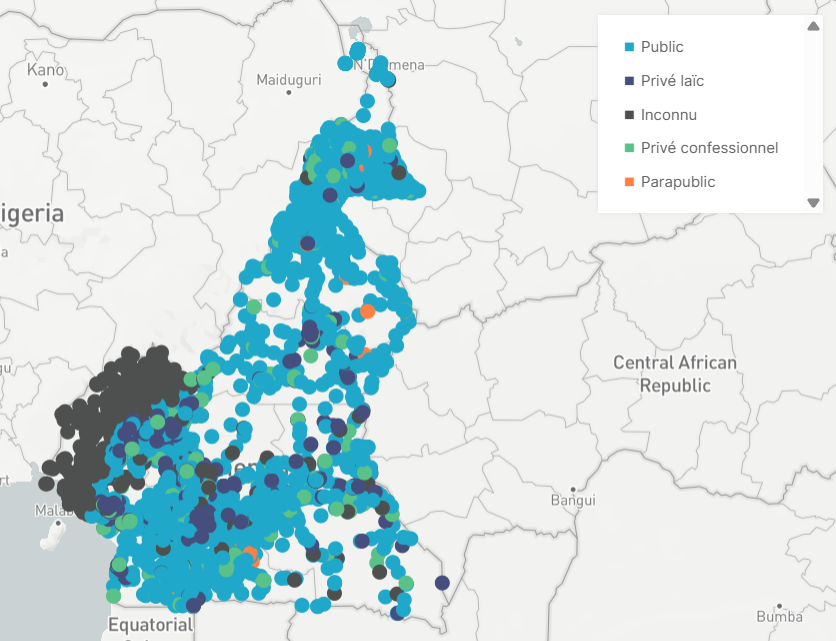
Bluesquare’s dashboards solution enables users to create, customize, and share dashboards tailored to their specific programs and geographies.

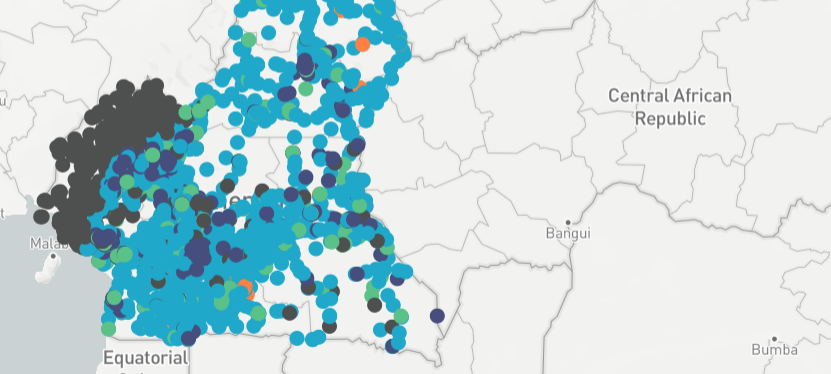
Superset health facility registry dashboard for Cameroon
Interactive maps
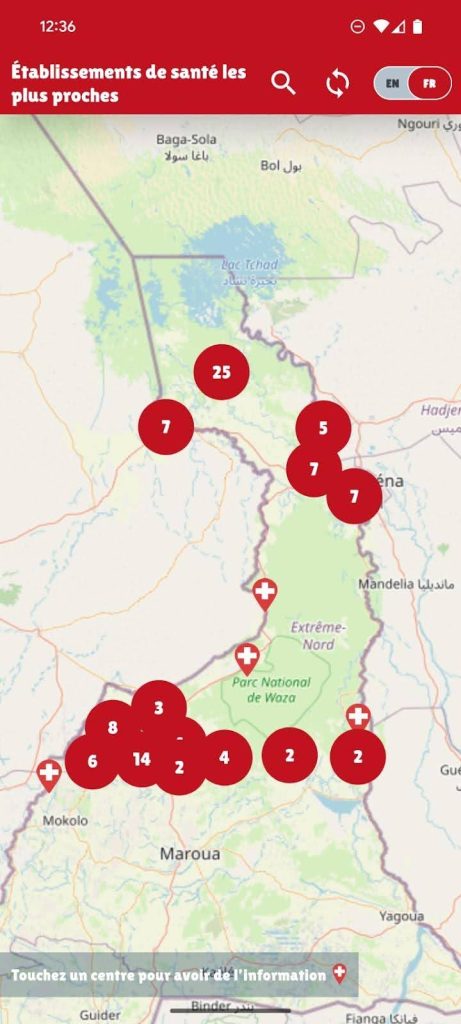
Maps are powerful for identifying geographic disparities in health services and outcomes. Whether showing health facility coverage, disease outbreaks, or resource allocation, interactive maps allow users to zoom in on regions, compare districts, and track changes over time.

Health facility mobile app for Cameroon
Motion infographics
For public awareness or stakeholder engagement, motion infographics can distill complex concepts into visually compelling animations. These are especially useful for non-technical audiences and for communicating progress in donor reports or advocacy campaigns.
Driving better governance through visualization
At Bluesquare, we believe that data should lead to action. That’s why we focus on transforming health data into clear, strategic visual tools that improve transparency, accountability, and coordination across health systems.
By empowering stakeholders with the right visual tools, we help bridge the gap between data collection and decision-making, ensuring that every dataset contributes to stronger, more resilient health systems.
Whether you’re looking to build custom dashboards, integrate data from multiple sources, or develop visual tools for better stakeholder engagement, Bluesquare is here to help.
Contact us to learn how we can support your data visualization needs and improve your health program’s impact:


