The global outbreak of COVID-19 has wide reaching impacts. Given the state of health systems in developing countries, although they are among the last countries impacted, the risks of significant repercussions from the outbreak are higher. For these countries, access to viable data is critical to help support strategic decision-making to reduce the number of infected cases and ultimately, the number of deaths.
With our broad experience in setting up information systems to strengthen the health systems in the countries we support, we support our clients with:

What is the capacity of the health system to respond to the COVID-19 outbreak? Has the country sufficient test screening capacity, Intensive Care Units, Personal Protective Equipment? And what will be needed in the future?
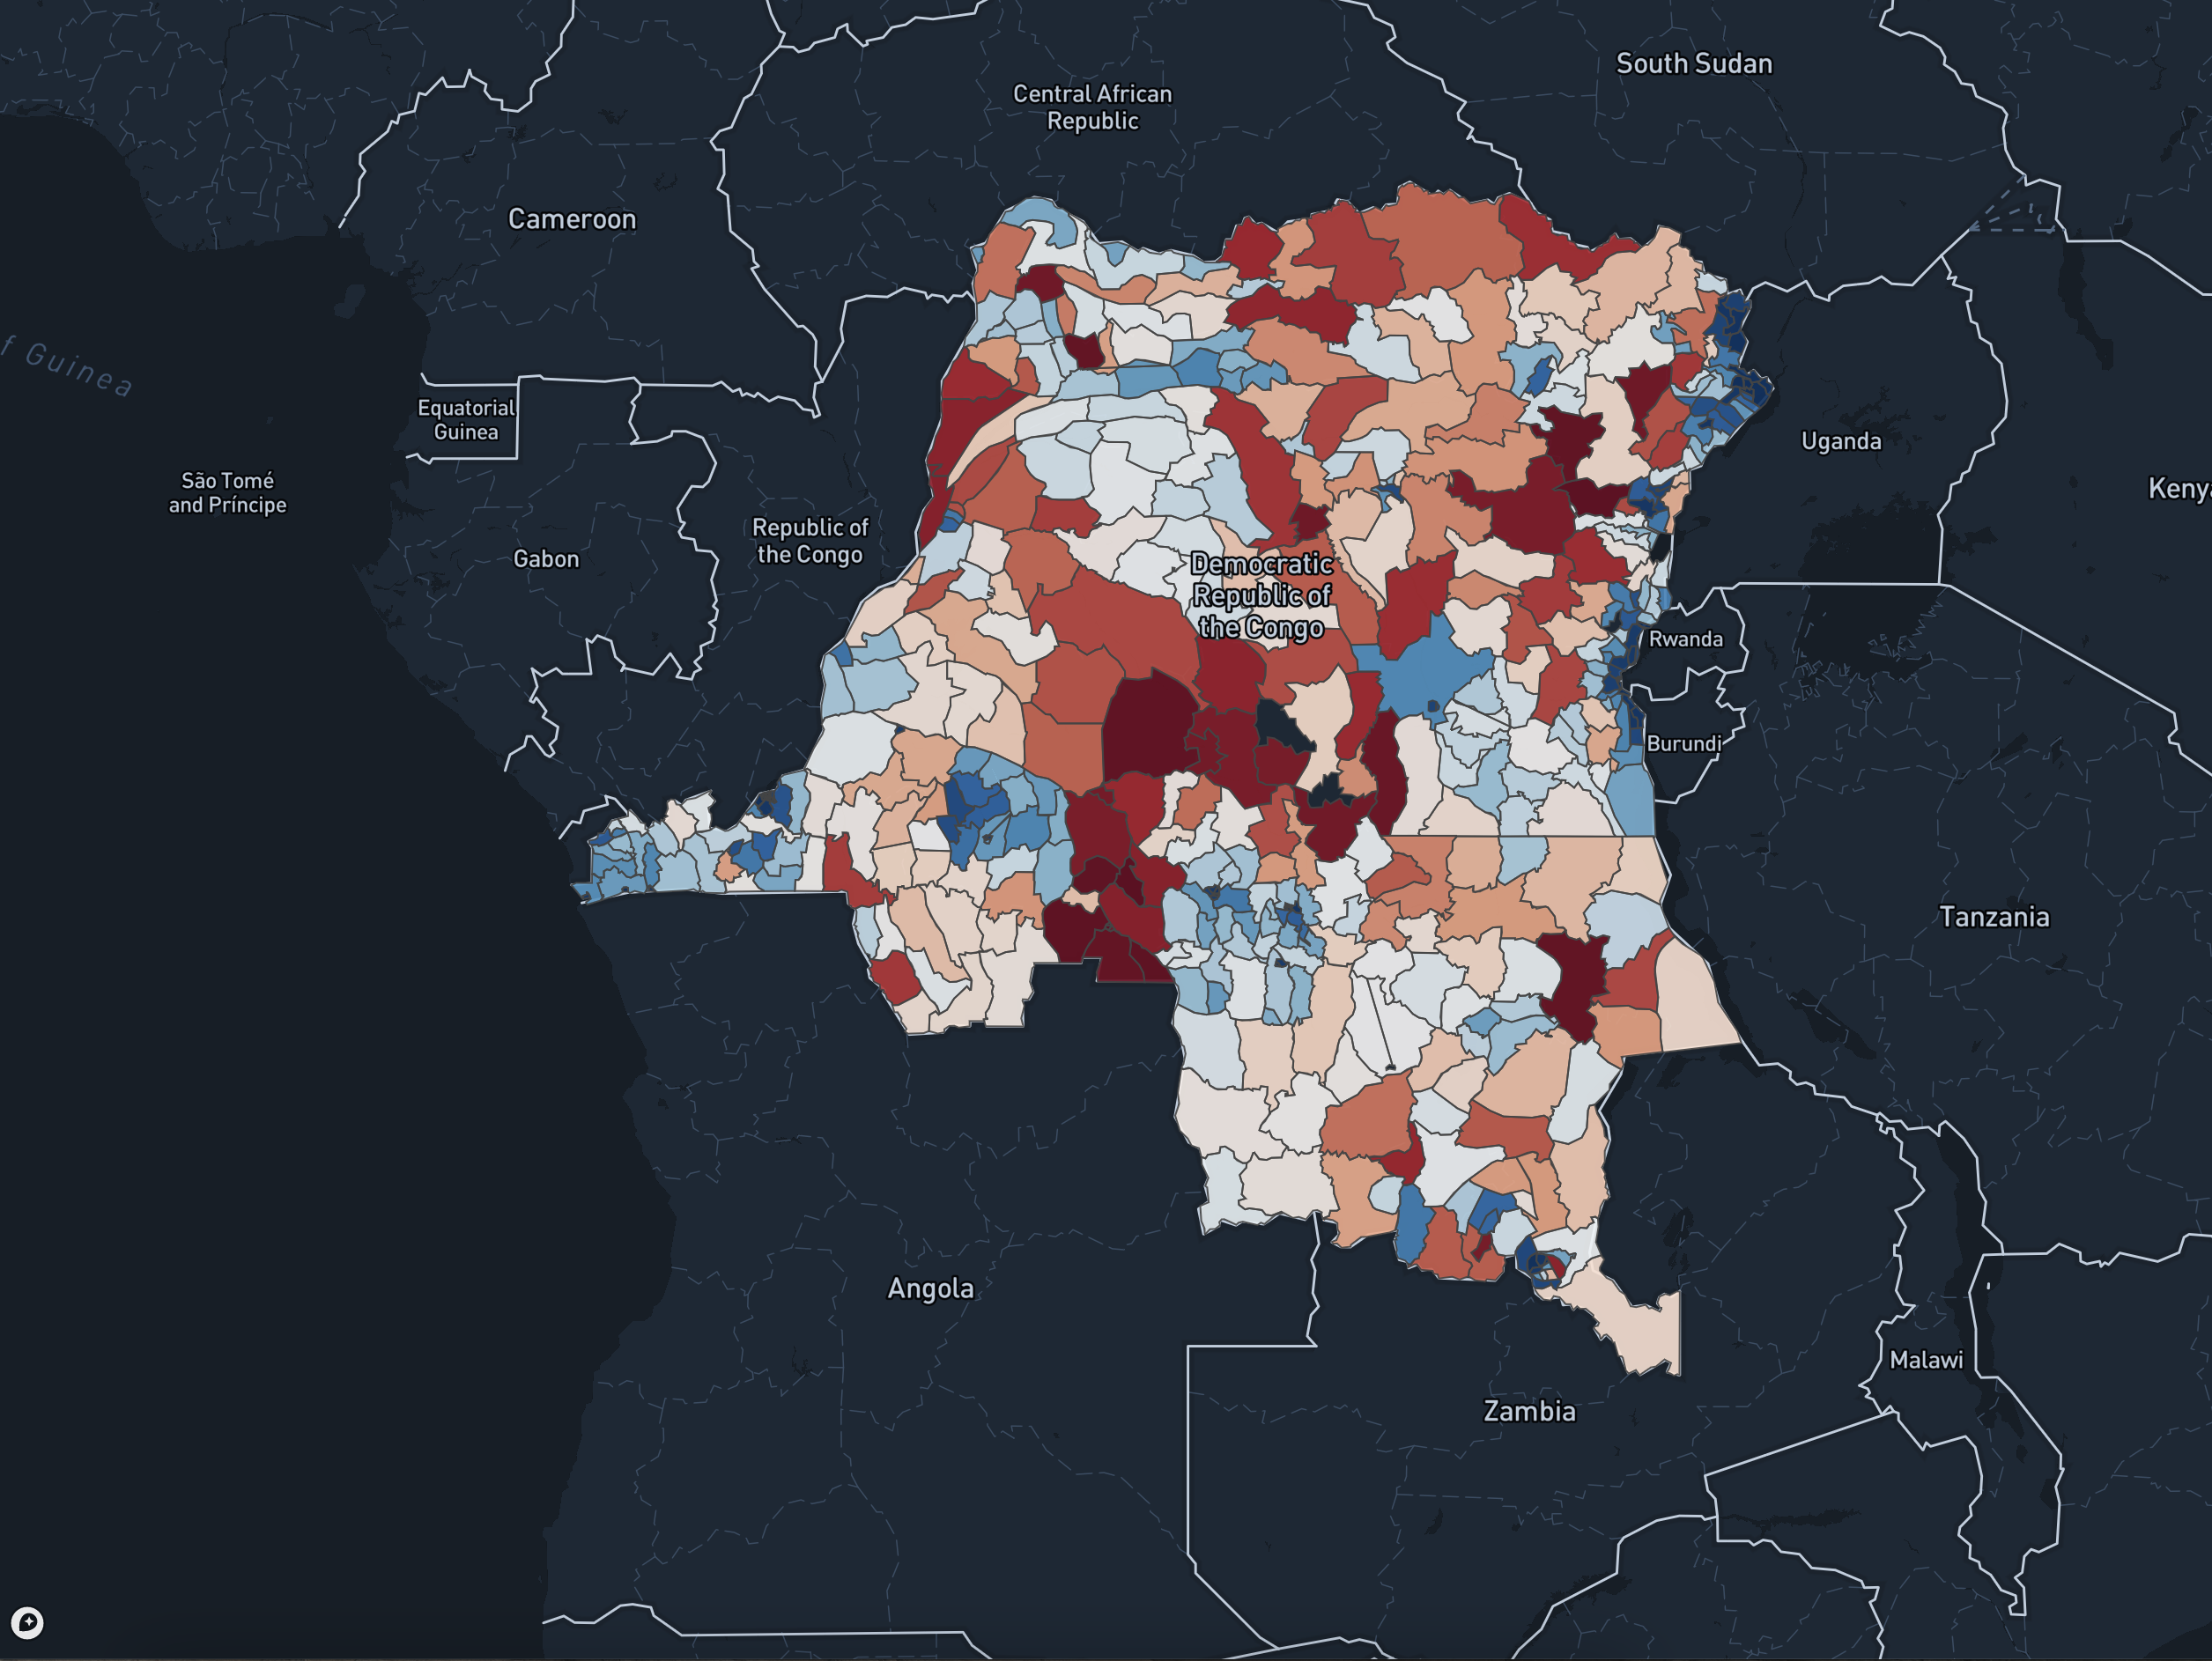
We help countries structure the information to setup and manage a continuously updated Covid – 19 digital health master plan. In countries like Niger, Benin and DRC, this requires the integration of multiple data sources to gain an understanding of service availability across the country.
In terms of the technology to help support this, we offer:

Many countries setup a data infrastructure for the COVID response that supports multiple data flows:
To accomplish this we deploy an integrated data architecture that includes :
Many countries have set up a call center to answer citizen queries related to the COVID-19. These call centers can make it possible to detect a large number of suspicious cases quickly. We offer our support to organize the data flow from your call center to the emergency response center, either by organizing an extraction of relevant data, or – ideally – by providing call center operators with a web interface to allow them to record suspicious cases directly.
We provide support in setting a DHIS2 tracker program so healthcare providers can register suspected cases directly.
We propose DHIS2’s COVID-19 tracker program for monitoring test results. This tool makes it possible to follow the cases at the level of the individual who has been screened, and then to carry out the analysis which allows a better understanding of the case distribution, for example:
Implementation of a tracker program for positive cases. Collection via the DHIS2 web application or via an interface based on Iaso supports offline collection before integration with DHIS2.
Establishing a tracker program for cases that are hospitalized including the following data points: admission, treatment and discharge. Encoding can be completed directly via the web application or mobile tools.
This data is then directly available in a DHIS2 platform. Bluesquare can then integrate this data (when needed) into the most useful DHIS2 instance for holistic tracking.

We have the capacity to support countries to implement a variety of types of dashboards. National dashboards can be built with tools such as:
Our experience across many countries has allowed us to acquire a solid knowledge of the databases available in health programming. Thanks to this experience, we can ensure data integration that will enrich the dashboards and other visualizations we set up.

Bluesquare is helping COVID response teams and national programs integrate multiple data sources to monitor the effect of COVID on other services. There is a widespread anticipation that the fear of COVID in health clinics will reduce the use of high impact services such as immunization, pre-natal care or malaria services.
Investigating this fallback necessitates advanced analysis of data stemming from different sources. HMIS data but also data collected by different partners in the health system on a variety of primary health care services (RMNCH-A, Malaria) or other services (Tb, HIV…) need to be standardized and matched. Additionally, the analysis needed to monitor the continued availability of services requires a variety of analytical skills based on advanced times series and health system research methods.
Bluesquare is setting up data integration platforms that integrate multiple sources of data to help monitor service availability. Depending on countries the list of these sources may vary. This integration allows a generic extraction of data sources that can be run on a regular basis. Extracted data is stored on a cloud instance, allowing multiple teams to access it (provided they have the required access level). Bluesquare will also create a cloud based data analysis platform (based on JupyterHub) allowing multiple teams to work in an integrated computing environment. Access to data and usage of this environment comes with the expectation that key results will be shared with the national Covid response teams in order for them to integrate these results in their analysis and dashboards.