Data Collect in the DRC: Patient feedback & monitoring socio-economic status
Health RBF programs typically evaluate patient satisfaction quarterly to verify the information declared by health centers about the services offered. Every quarter, a sampling of patients who visit the health facility are interviewed usually by Community-Based Organizations (CBO). Once data has been collected, a “community satisfaction score” is calculated for each provider, which impacts the payment/bonus allocated to that provider. In most countries, this process is paper-based.
Working alongside the Dutch NGO Cordaid in South Kivu, the Democratic Republic of the Congo (DRC), BlueSquare deployed its mobile data collection tool for the first time in September 2015 to collect feedback from patients who received services from the health centers targeted by Cordaid’s Results-Based Financing (RBF) programme.
This first pilot was conducted in the district of Walungu in South Kivu with the support of the “Agence d’Achat de la Performance (AAP)” — the RBF purchasing agency also in charge of external verification. This pilot helped test the first set of functionalities and refine the analysis to optimize the use of technologies in support of patient satisfaction verification.
BlueSquare’s new Data Collect app covers the entire process of collecting patient feedback and has already been deployed for RBF programs in the Republic of Congo, Haiti and Benin. This new release gives full autonomy to the program or/and data managers by allowing them to optimize data management in one easy-to-use single app.
First of all, program managers have access to the management of the entire application which means that they are able to create and manage CBOs conducting the survey. A list of all the CBOs and their details is accessible, enabling deleting, modifying or adding new CBOs as the project evolves.
The sampling management can also be done through the application by creating the sampling, and monitoring the data collection process and completeness.
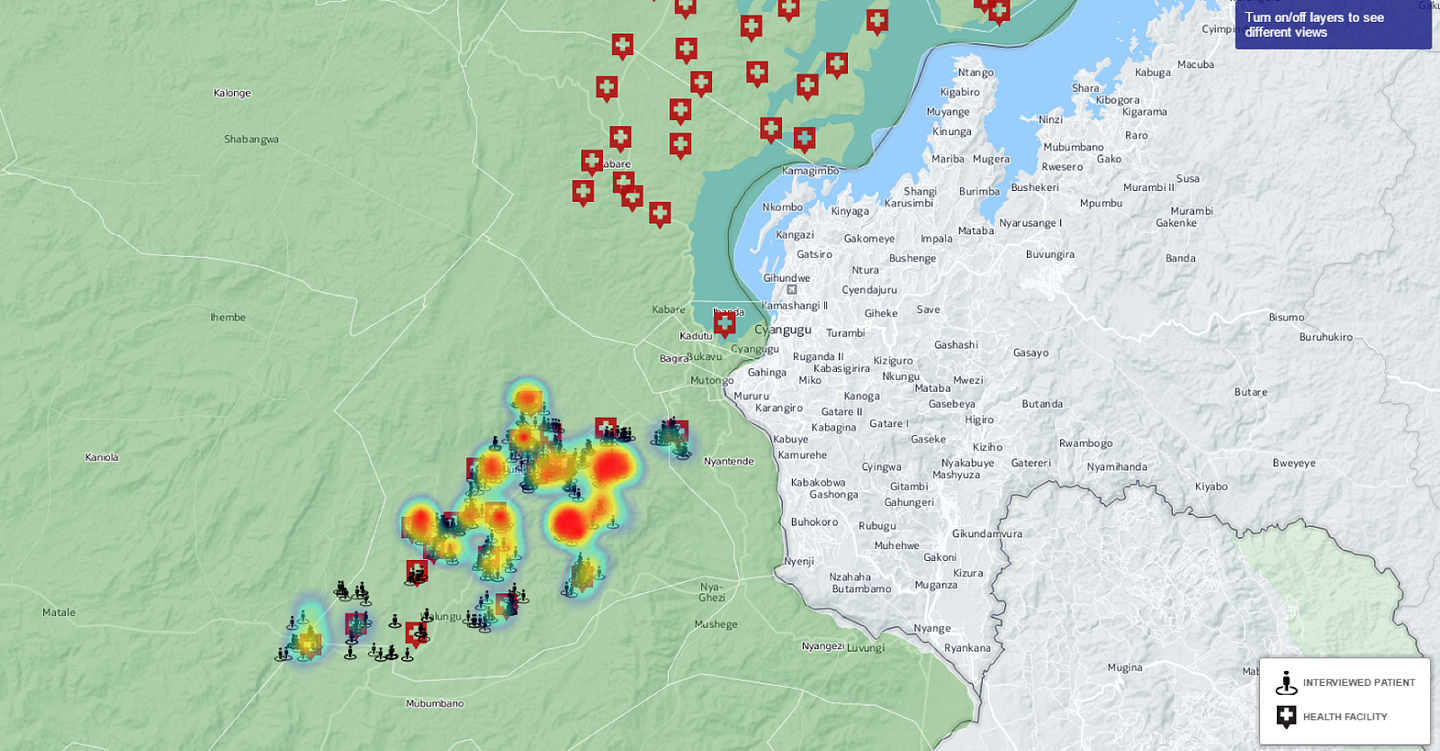
Once the sampling has been created, and depending on the specificity of the context, program managers collect patient feedback through ace to face interviews. Face-to-face interviews allow geo-coordinate data to be collected, which in turn allows program managers to further analyse their data by, for example, correlating the location where people live with health indicators to understand the level of attractiveness of a health center.
Most importantly, we have integrated the Data Collect app with DHIS2 — which stores all data automatically after they have been collected. This integration enables program managers to have access to and analyze disaggregated as well as aggregated data at the level of a health facility, a region, or a category of patients. Program manager can create graphs, maps, and tables to visualize any indicator or set thereof and organize them by health centers, regions or categories of respondents. As all the data is stored in the database which allows analyzing and visualizing data over time.
The connection to DHIS2 means the Data Collect app can connect to any DHIS2-based data system and thus share data with any public web-based dashboard connected to it, enhancing programs transparency and accountability.

The application uses an algorithm to automatically compare data collected during interviews and information from the sampling to (1) verify the right patients were interviewed, (2) identify fraud (when providers declare patients that do not exist), and (3) verify that the services declared by the health facility and reported by the patient match. This algorithmic verification enables the data manager to quickly evaluate the quality of data collected and the number of cases that will need further investigation. Every single form can be accessed individually and compared to the original information.
Finally, Data Collect allows program managers to generate a score. Calculation methods can easily be configured through the app. As a result, financial incentives or bonus’ health facilities are entitled to are automatically calculated, which contributes to reducing human error during calculation, as well as the time needed to process payments. The results of the community score can be visualized in the application and program managers are also able to send the score directly to RBF data systems.
Over the last 6 months, BlueSquare has integrated an algorithm to group respondents into wealth quintiles based on a limited set of indicators. The indicators were developed by a panel of experts in the field of wealth measurement and the Demographic and Heath Survey (DHS) wealth index including the World Bank, Results 4 Development Institute, Metrics for Management, USAID and more.
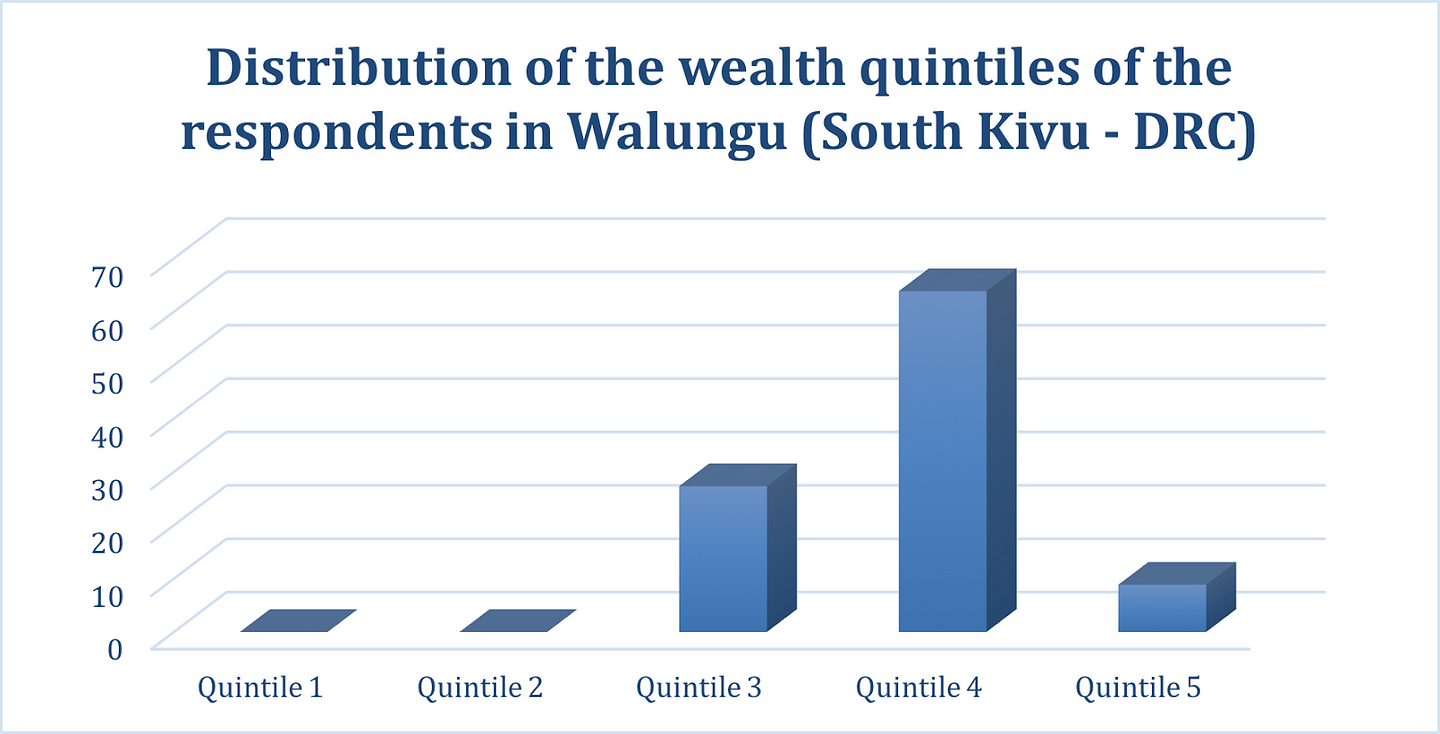
In South Kivu’s District of Walungu, the correlation of wealth and patient feedback data showed that none of the patients who participated in the satisfaction assessment belonged to the bottom two quintiles (the poorest). More than two-third of the respondents belonged to the fourth quintile, while some 27% belonged to the third quintile and nearly 9% to the fifth.

Data collected on the socio economic status brings additional information about those participating or benefiting from the program and can help better monitor and steer the programme.
In conclusion, Data Collect is making great strides to support program managers in collecting, analyzing and managing patient feedback data to better understand the impact of their programs, all while increasing the overall quality of the data collected.
Written by Julie Vanhamme, Project Manager of BlueSquare. Find her on LinkedIn here and Twitter here.