
Dataviz summer update

We have had 6 busy months since January and we have plenty of new features to announce!
New – portal homepage
To provide visitors with a clear introduction and overview of the site, we have added a fully customisable homepage to all portals. You can now present the program objective, data collection process, partners, useful links, publications and more directly on this page.

View a facility’s categorical data
Using the DHIS2 organisation unit groups, we are now able to show the ownership of each facility to one or multiple groups on the map.

When you zoom out of the map, the statistics for that zone appear as you hover over them.

Additional options to visualise your data
In order to respond to the growing diversity of our clients’ needs, we added a few new ways to visualise your data.
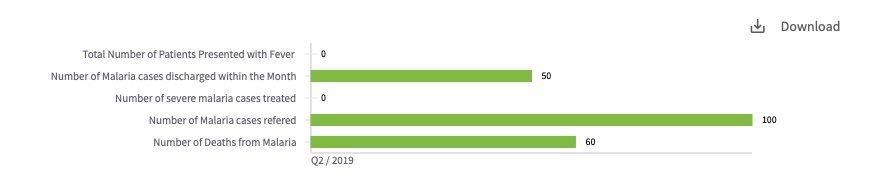
Vertical charts
Best used to compare current values of connected indicators.
True / False key indicators visual improvements
Perfect for visualising service availability like water/electricity access or stock out monitoring.

Heatmaps
Monitor resources over time with this widely requested chart type option. Define your own color scale for each indicator using color legends set in DHIS2.

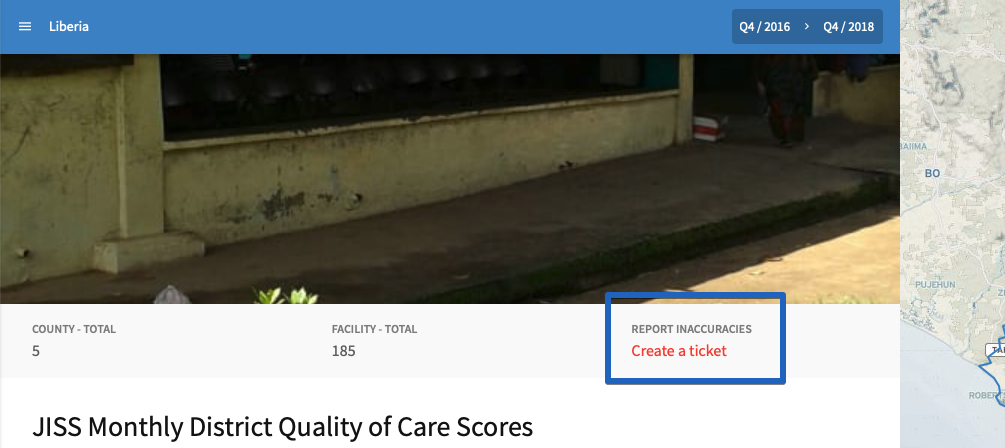
Inaccuracies reporting tool
We added this very simple tool that allows someone to easily report issues regarding the data for any facility displayed. It opens a mail with all the facility details and allows the person to explain what and where the issues are.
Improved mobile experience
We noticed an increasing number of users viewing the portals on mobile devices. With this a need to easily report inaccurate information via mobile is growing. So we have focused on improving the user experience for mobile.
Map layers are now grouped and easy to switch
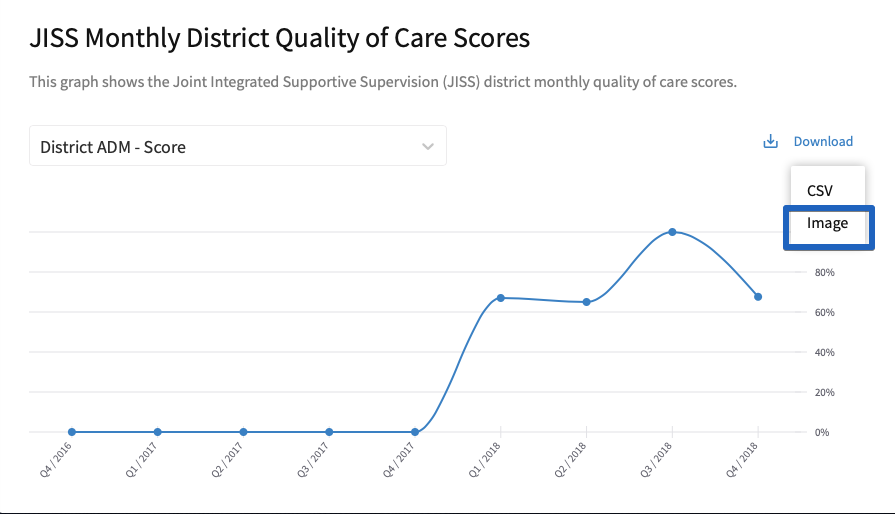
Download a graph as an image
That’s all for now but do not hesitate to reach out with ideas or feedback on your Dataviz instance. We are happy to support your programs with this tool.


