Geospatial Data: a Revolution in how we understand the accessibility of Healthcare Services
Mrs X was eight months pregnant when she died. There are many reasons for her death, and any one could have tipped the balance. Health education. Family planning advice. Better access to antenatal and facility-based care. It is a familiar story, and one that must still be told*.
The fact is, that even in today’s era of Sustainable Development, 50% of the world’s population live without full access to essential health services. It’s a complex issue about more than just the availability of health centres and facilities. There are countless variables to consider, including cultural acceptability, affordability and physical accessibility. Focussing on the latter, if the world wants to make universal health coverage a reality, it must build an accurate picture of the situation on the ground. The ‘haves’ and ‘have-nots’ of healthcare access. As experts in health data science and technology, at Bluesquare we believe that geospatial data has the power to unlock this information. And we want to take this chance to explain why.
The limitations of current accessibility models
Traditional measures of physical healthcare access – Euclidean distances and 5km catchment zones – simplify what is, in reality, a far more complicated situation. Evidence shows that service uptake decreases with distance, travel time and other logistical barriers. An expectant mother might live within 5km of her local health centre. But if it’s too far to walk, there is no car, affordable public transport, or the road becomes impassable, then she cannot get there.
It is a reality compounded by the fact that current geospatial models do not give policy and decision-makers the information they need to effectively improve healthcare accessibility. Produced on a per-project basis, methods are rooted in regional population estimates and siloed datasets that are static and imprecise. The results are paper-based reports that simply cannot account for the variables that define healthcare access as experienced on the ground.
In this situation, accessibility measures become theoretical. There is little space for local validation of resulting models, with real-time variations of service availability rarely examined. Yet if ambition towards universal health coverage is to be achieved, we must understand and account for reality. Only then will governments and global health actors have the information they need to drive development forward.

Combining geospatial modelling and Big Earth Data to better understand healthcare accessibility
Leveraging recent advances in geospatial modelling, the team at Bluesquare is working to build digital tools that allow for the automatic and rapid computation of accessibility metrics from multiple data sources. For example, in recent years we have seen the development of several open-access libraries providing essential, high-quality data. These include, but are not limited to:
- The high-resolution land cover maps provided by Sentinel mission.
- Spatial demographic/population data maps developed by WorldPop.
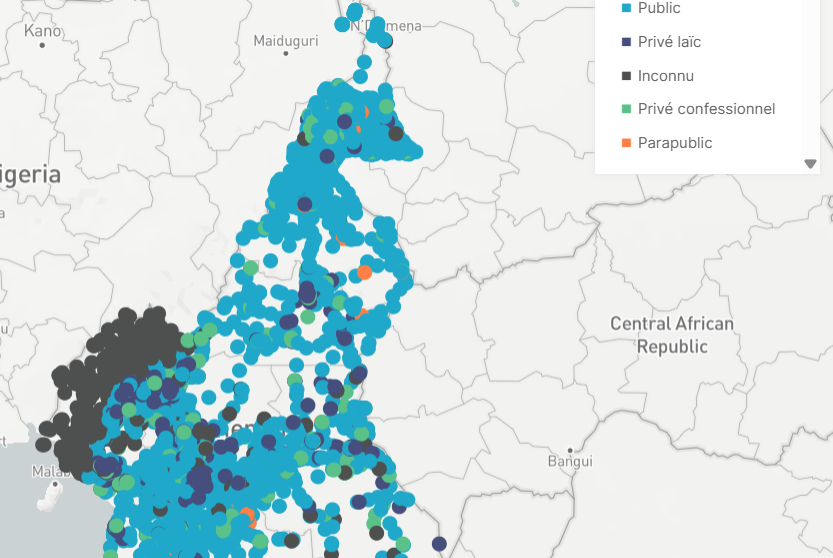
- Crowd-sourced geographic information from OpenStreetMap.
Capturing variables that influence healthcare access in real-time (topography, road networks, population distribution and demographics). Together these sources create a newly available set of ‘Big Earth’ data. It can be easily read, updated and integrated into modern accessibility models.
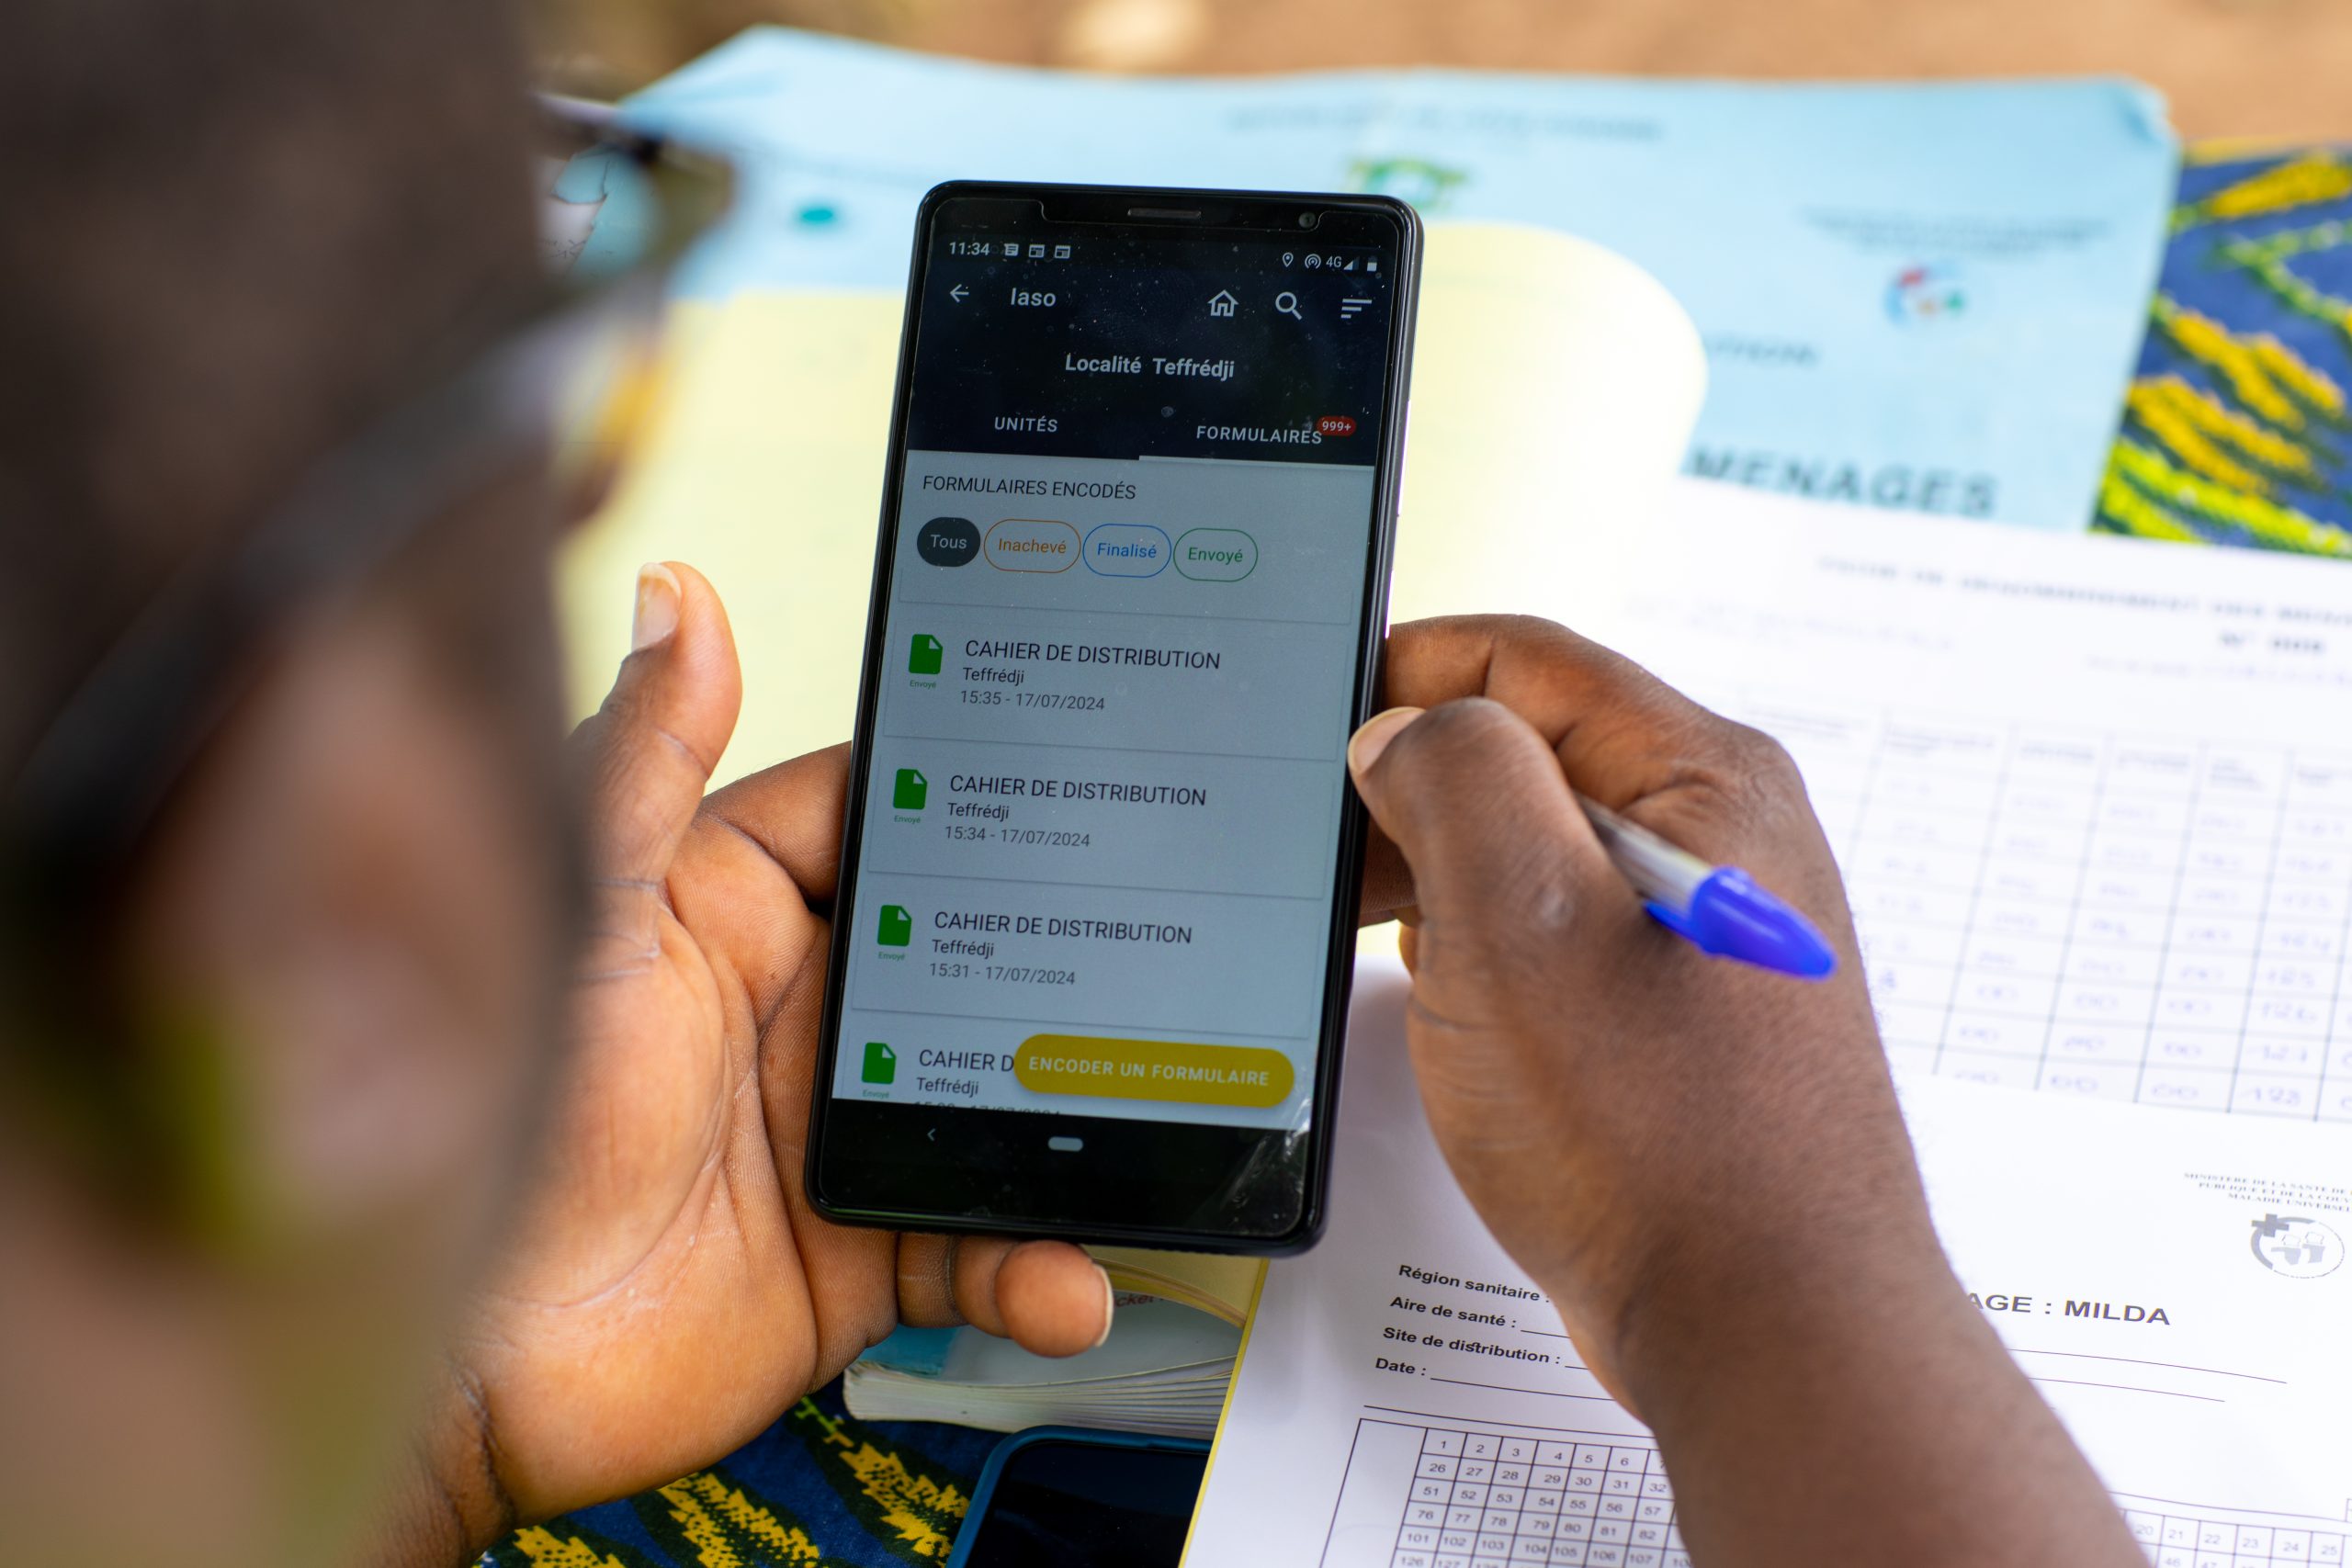
Combining this information with routine health data, BlueSquare joins the Spatial Epidemiology Lab from the University of Brussels and the University of Geneva in new research to ‘productivise’ this process. This uses machine learning and artificial intelligence to automate near-continuous updates. This combination of advanced geospatial modelling, ‘Big Earth’ and real world data allows users to develop digital accessibility maps that empower them to:
- Understand healthcare accessibility down to a local, village level.
- Calculate key accessibility metrics in line with local public health priorities.
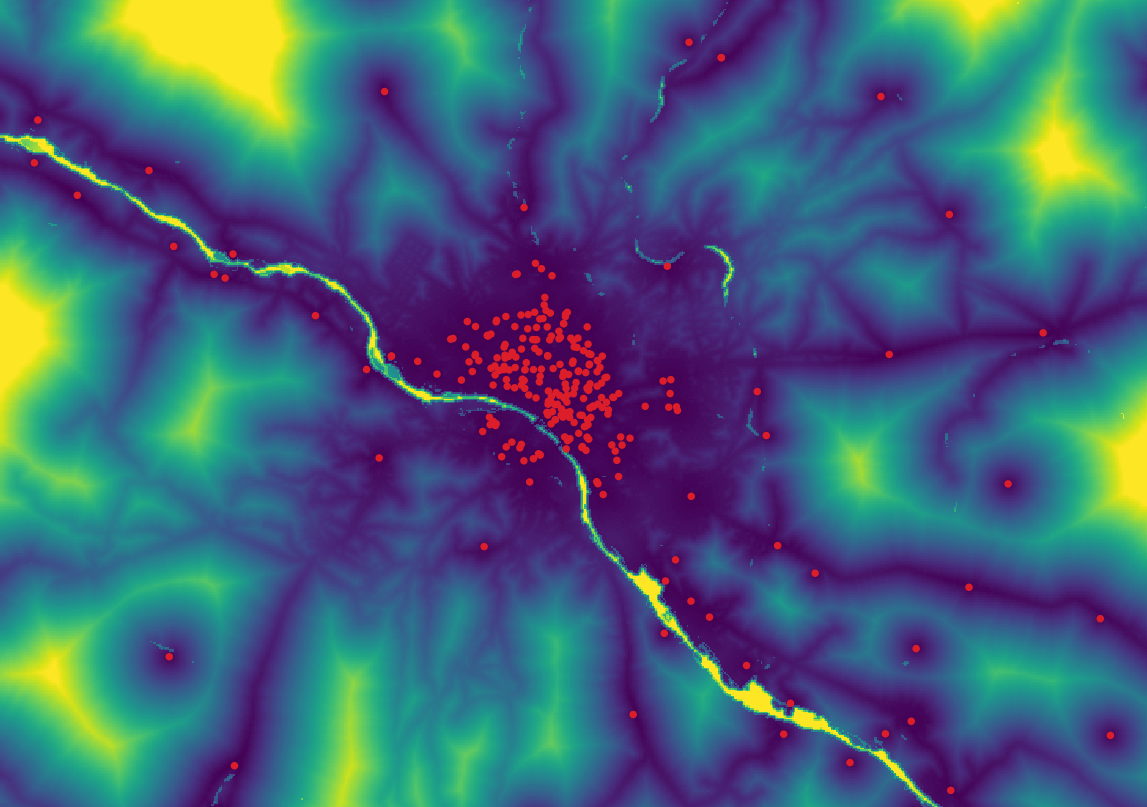
- Accurately map facility catchment areas, population access and travel time.
- Focus on specific population subsets and demographics (e.g. women of childbearing age).
- Account for socio-economic variables, including ethnicity, religion and household income.
- Tailor input data to account for multiple scenarios, including seasonal changes.
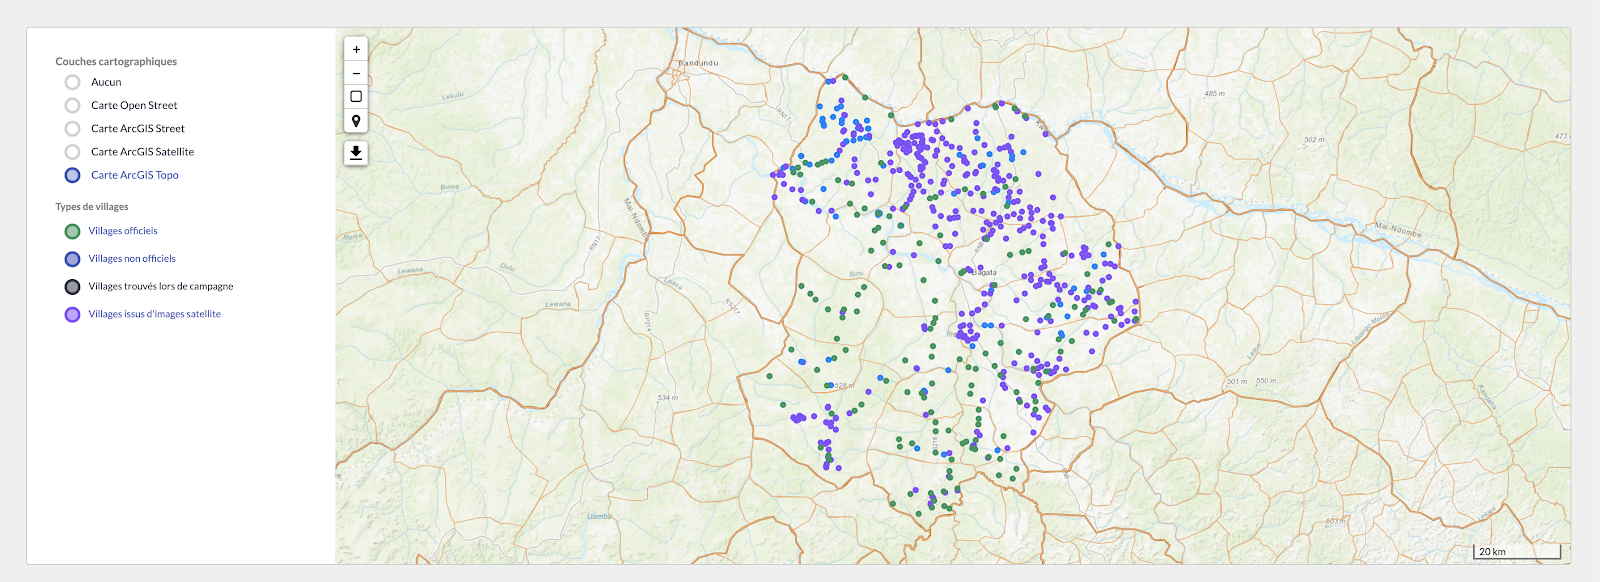
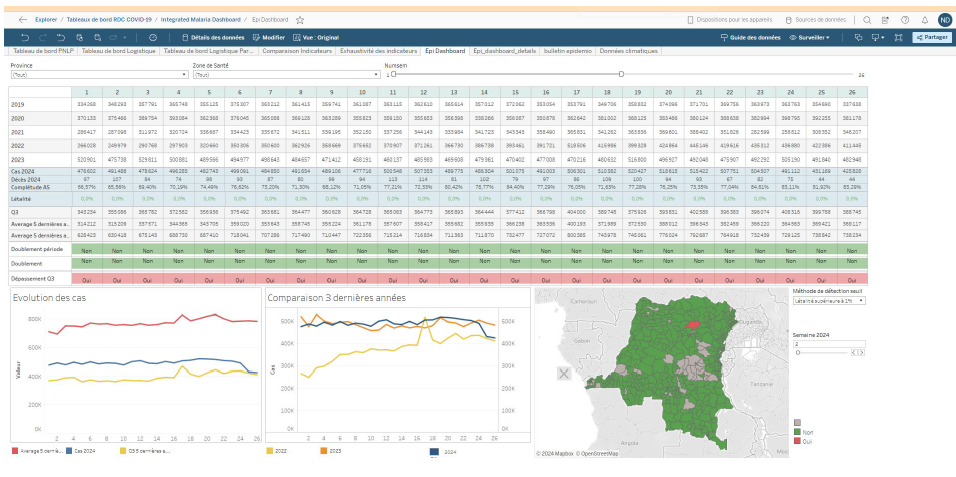
With pilot models currently focussed on the Democratic Republic of Congo, Niger and Senegal, policy and decision-makers can now have an up-to-date picture of health service access as it happens on the ground. This process allow for enhanced accessibility mapping. It also makes it dynamic – allowing global health actors to track healthcare accessibility in evolving situations and tailor their response accordingly.
There will be some hard truths to face. With preliminary work in Senegal showing 80% of women living with reduced, or no, access to family planning, current understanding around healthcare access will almost certainly shift. It is important that it does. By improving the way physical healthcare accessibility is defined and measured, we can create new opportunities for a data-driven future. One that allows for the smarter allocation of health resources and has the potential to revolutionise access to healthcare.
*The story of Mrs X was first told by the WHO in 1988 and retold in 2012. Click here for more information.