As vaccine-preventable diseases like measles resurface, precision public health is no longer an option—it is a necessity. By automating the integration and analysis of routine data, Bluesquare transforms epidemiological risk management into a targeted, high-impact decision-making tool.
Effective health interventions too often rely on a partial and/or granular understanding of the field. Data integration is about bringing together information silos to create a holistic, dynamic view of the health landscape.
Too often, vaccination coverage, supply chain information, and demographic data reside in separate silos. At Bluesquare, we connect these routine systems to create unified data platforms (such as DHIS2), thus ensuring true interoperability. This approach moves beyond retrospective analysis to near real-time epidemiological surveillance, which is essential for identifying immunity gaps before they lead to outbreaks.
Automating data orchestration and analytics through pipelines is at the core of our expertise. Instead of manually compiling quarterly reports, our tools automate data extraction, cleaning, investigation and visualization. This efficiency allows decision-makers to focus on interpreting results and implementing data-driven policy changes, such as operational immunization planning. By connecting analytics directly to existing data flows, we make Precision Public Health both practical and scalable.
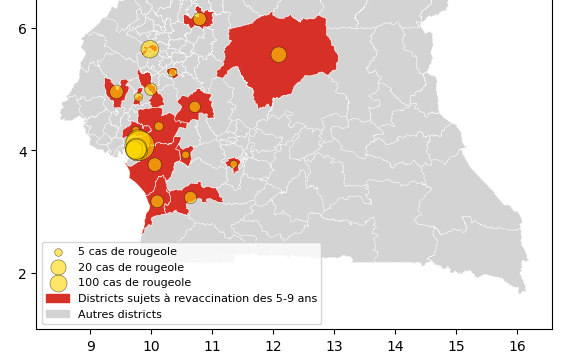
Measles remains a significant threat in Cameroon, with a steady resurgence over the last five years. To support the national immunization program, Bluesquare developed Epimaps, a risk mapping tool that illustrates the power of data integration.
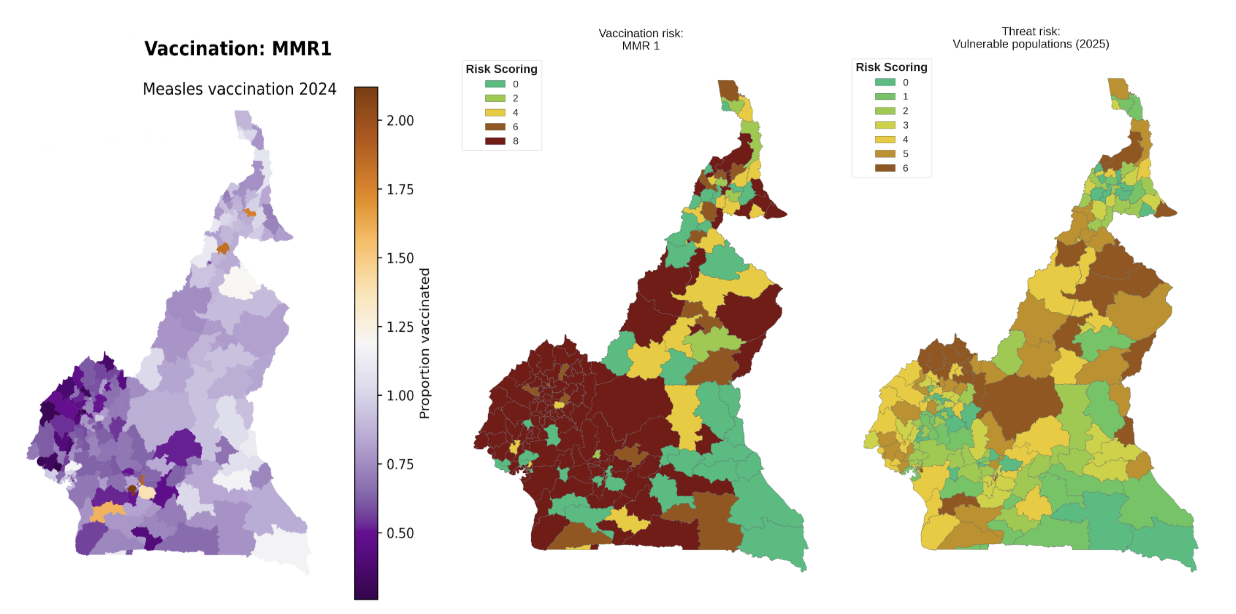
National averages often mask critical disparities. In this context, the World Health Organization (WHO) proposed a Measles Programmatic Risk Assessment Tool, which assigns each district a low, medium, high, or very high risk category, based on a composite score of key public health dimensions. While the average measles vaccination coverage in Cameroon is approximately 80%, granular analysis reveals that in districts classified as “very high risk”, this rate drops to 71%. Integrating geospatial and demographic data allows us to visualize the areas of insufficient vaccination, turning abstract statistics into actionable landmarks on a dynamic risk map.
The impact of this tool is measurable: in areas that we identified as “very high risk”, 78% of suspected cases tested positive, compared to only 24% in low-risk areas. This precision guides investments and prioritizes catch-up campaigns where the need is most urgent. Data integration does more than just document risk; it becomes a vital decision-support tool to prevent epidemics.
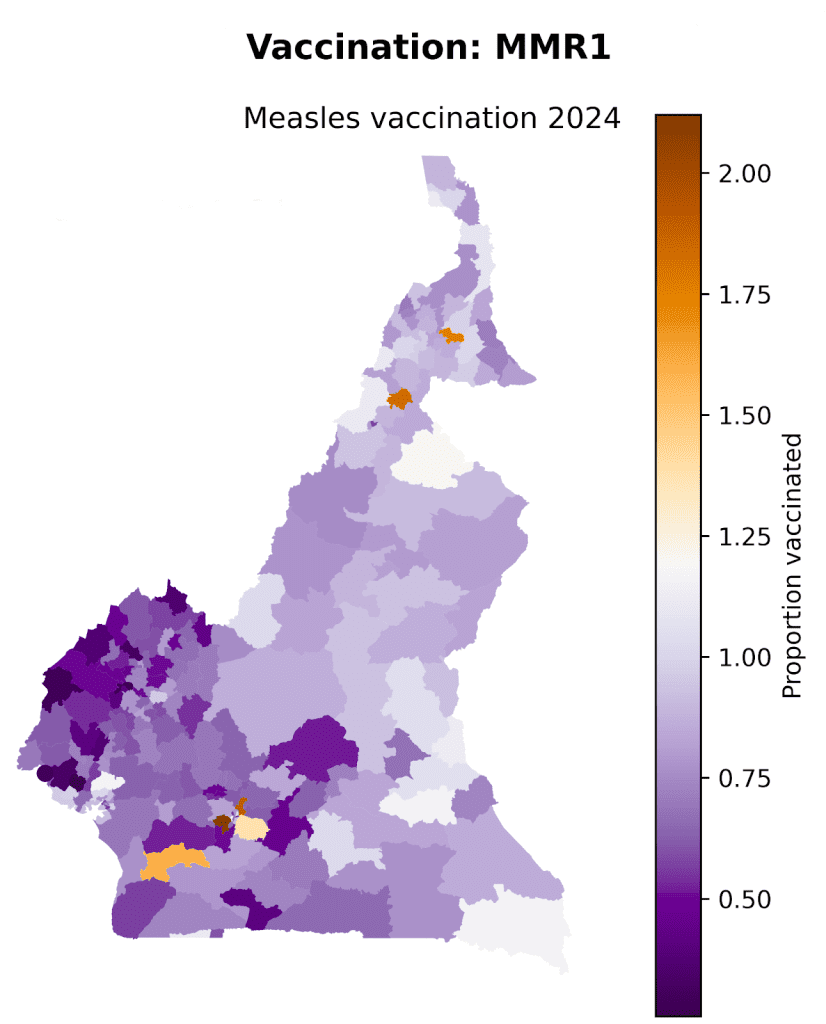
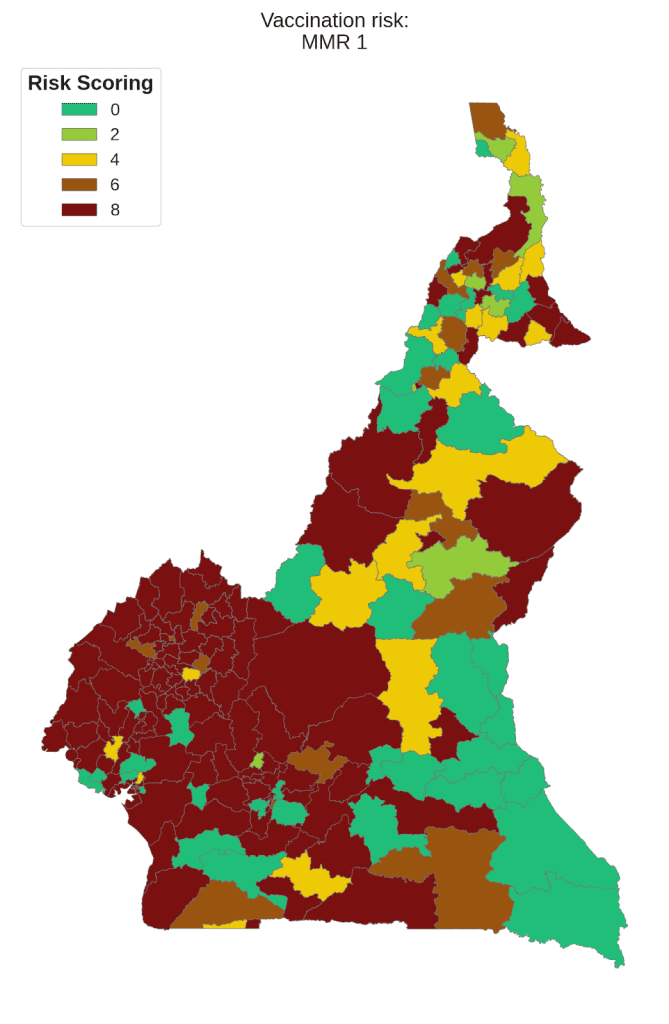
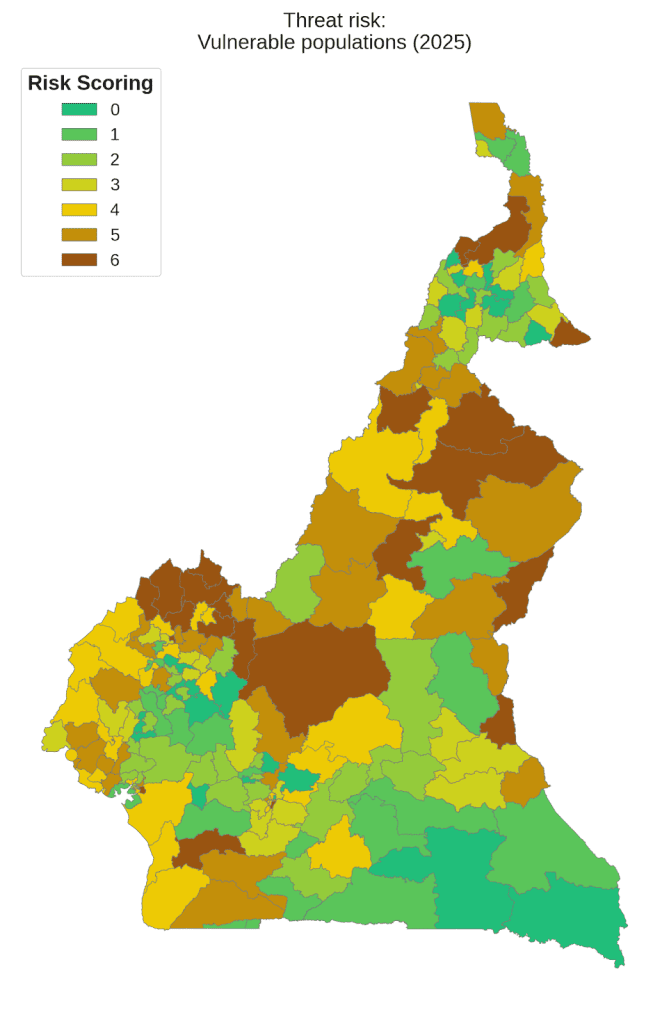
1. Measles vaccination proportions 2. Measles vaccination risk 3. Vulnerable populations
Transitioning from static planning to dynamic risk management is vital for building resilient health systems. Automation enables the continuous update of Key Performance Indicators (KPIs), ensuring that every resource is optimally allocated. By investing in data integration, governments and partners do more than just react to crises—they build an infrastructure capable of anticipating them.