At Bluesquare, we believe that data only translates into value when it is accessible, visual, and easy to explore. Over the past few years, Apache Superset has become a cornerstone of our data stack, allowing us to manage complex datasets at scale. We are glad to finally have at hand a powerful open-source BI tool matching our philosophy of work.
We are opening our infrastructure to our partners with a dedicated Superset hosting offer, designed for organizations that need powerful analytics without the operational headache.
Before offering Superset as a service, we stress-tested it internally. We needed a tool that could handle millions of records and provide a seamless experience for both data scientists and end-users.
Apache Superset stands out in the BI landscape for its flexibility. It provides a comprehensive and flexible business intelligence environment designed to meet the needs of both technical and non-technical users. Its intuitive no-code interface enables users of all skill levels to quickly build interactive charts and dashboards through a simple drag-and-drop experience, while SQL Lab offers a powerful web-based SQL editor for advanced users who need to write, execute, and visualize complex queries.
The main features of the tool include:
Its ability to connect to a vast array of databases makes it the perfect fit for fragmented data environments that require a unified visualization layer. The platform includes more than 40 ready-to-use visualization types—ranging from bar and line charts to geospatial maps—and features a plugin architecture that allows for further customization and extension.
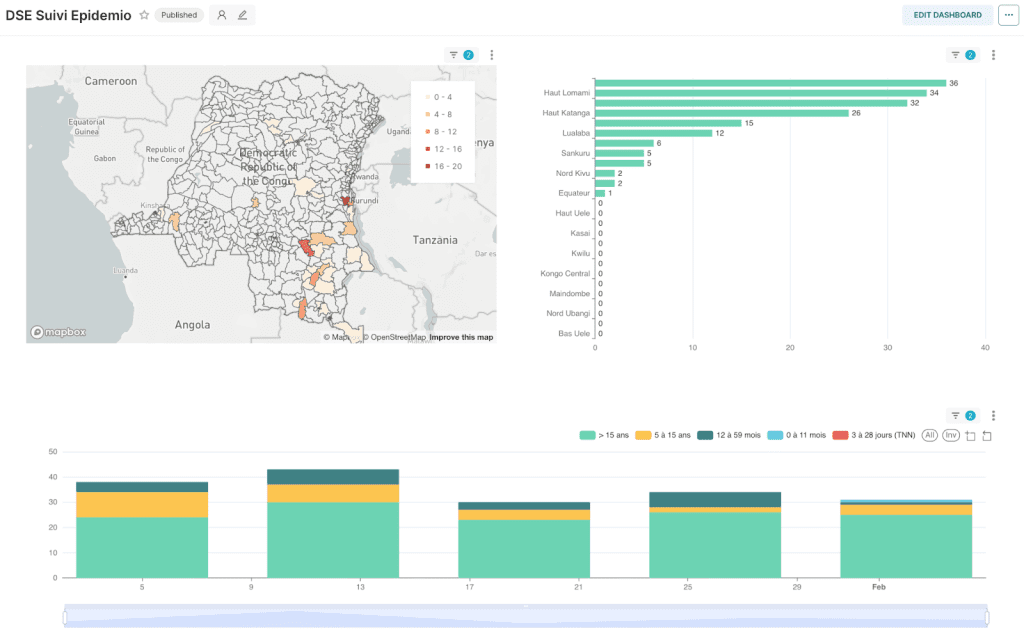
Superset dashboard – DSE Suivi épidémiologique project: 3 visualization types out of the 40 options available
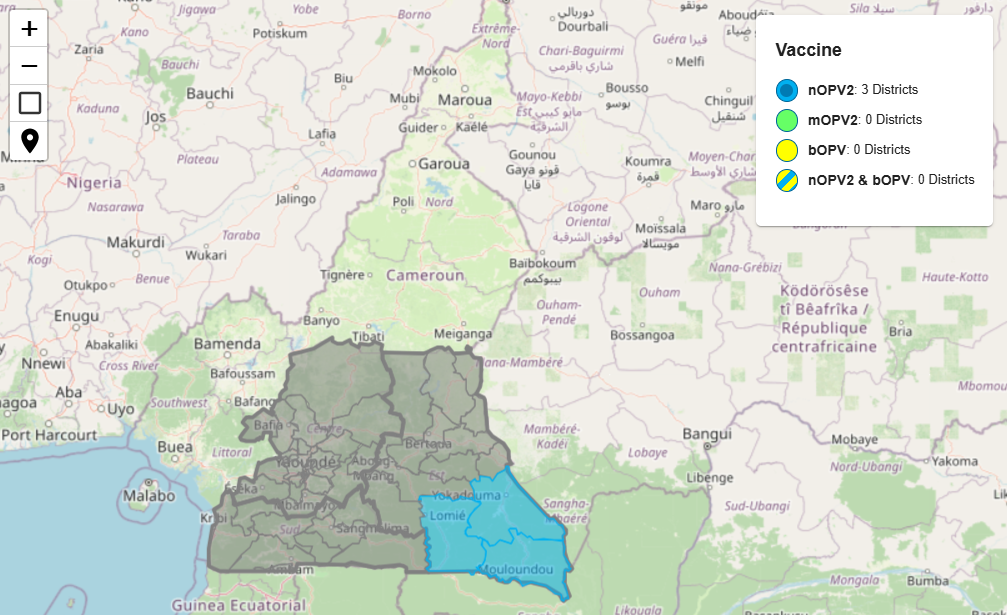
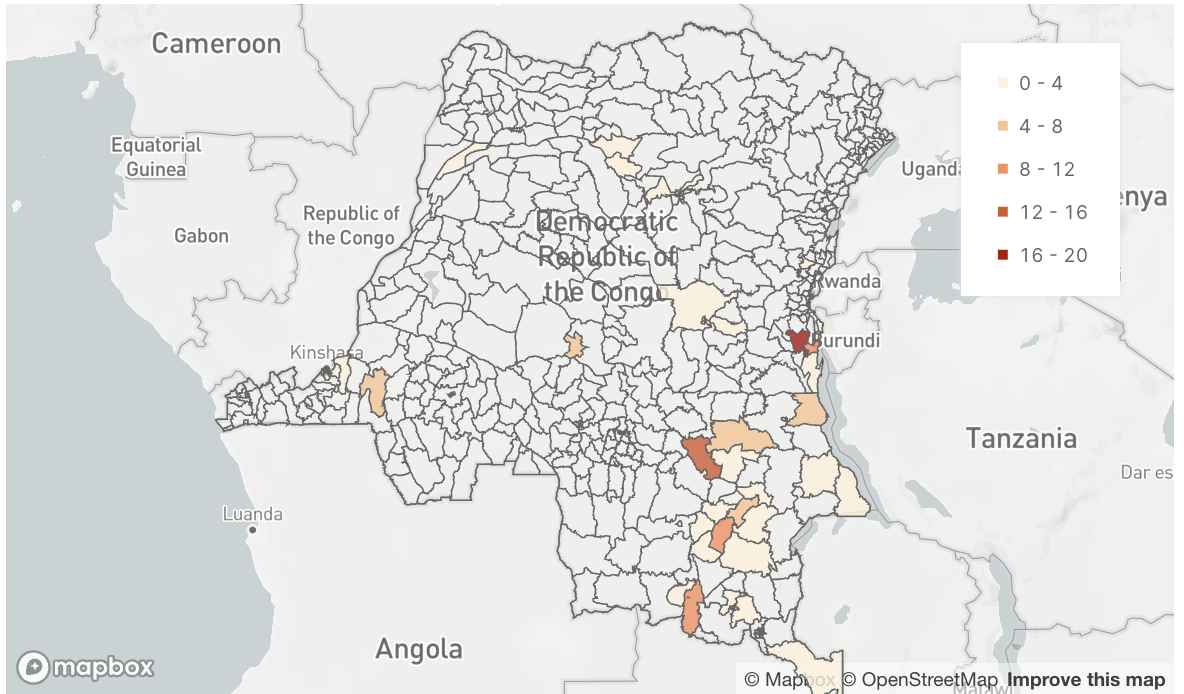
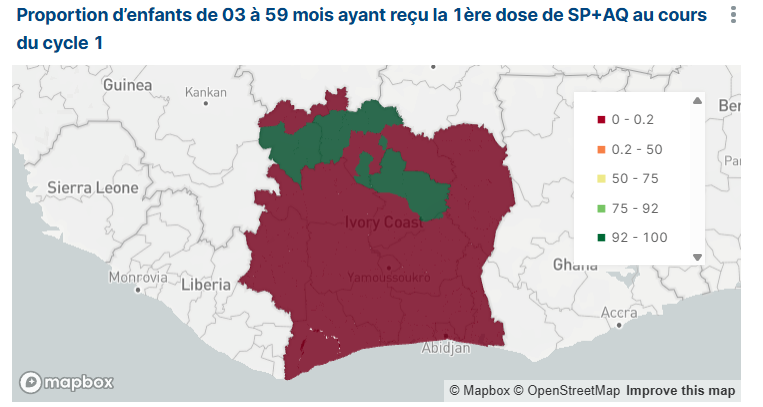
Our experience is grounded in real-world operations. We currently run over 70 dashboards on our main instance, along with multiple local deployments. From supporting PNLP logistics in Cameroon and the DRC, to creating health maps in Niger, and managing CPS campaigns in Côte d’Ivoire, our tools handle a wide range of data streams: from geographic mapping and logistics tracking to advanced predictive modeling. By operating more than 20 high-traffic, production-ready dashboards every day, we have refined the expertise needed to optimize Superset for both performance and stability.
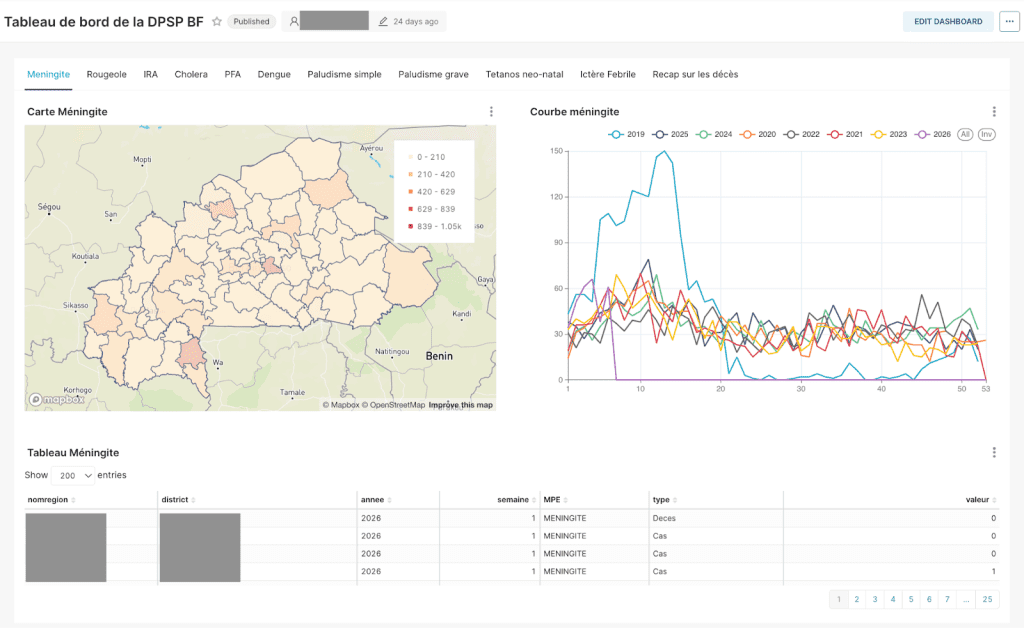
Superset dashboard – DPSP project: dedicated dashboards brought together within a single global interface for visualizing outbreaks, integrating data from multiple sources.
Setting up, securing, and maintaining an open-source BI platform requires specific DevOps expertise. Our managed hosting service is built to remove these technical barriers, allowing your teams to focus on what matters: your data.
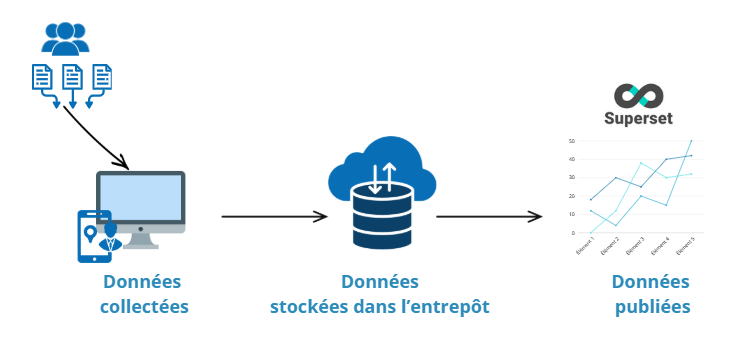
Data flow for public dashboards (Superset)
Data security is not an option; it is a core requirement. Our managed hosting offer is designed to meet this standard, with robust security protocols, regular updates, and high availability built in by default.
Apache Superset enhances this foundation through extensive connectivity, seamlessly integrating with virtually any modern SQL database or data engine such as PostgreSQL, MySQL, Presto, Trino, or Snowflake, while providing strong security mechanisms including role-based access control (RBAC). Within our fully managed environment, data sovereignty is fully respected, ensuring you retain complete control over where your information is hosted and who is authorized to access it.
Choosing Bluesquare’s hosting means benefiting from a team that understands complex data structures. We can easily create and share interactive dashboards providing dynamic and customizable views of key insights. Our support goes beyond simple hosting. We understand the nuances of:
Cohort performance indicator
Whether you are migrating from a legacy system or building a new data-driven culture, our team provides the infrastructure and the expertise to help you succeed. We combine the agility of open-source technology with the reliability of a professional managed service.