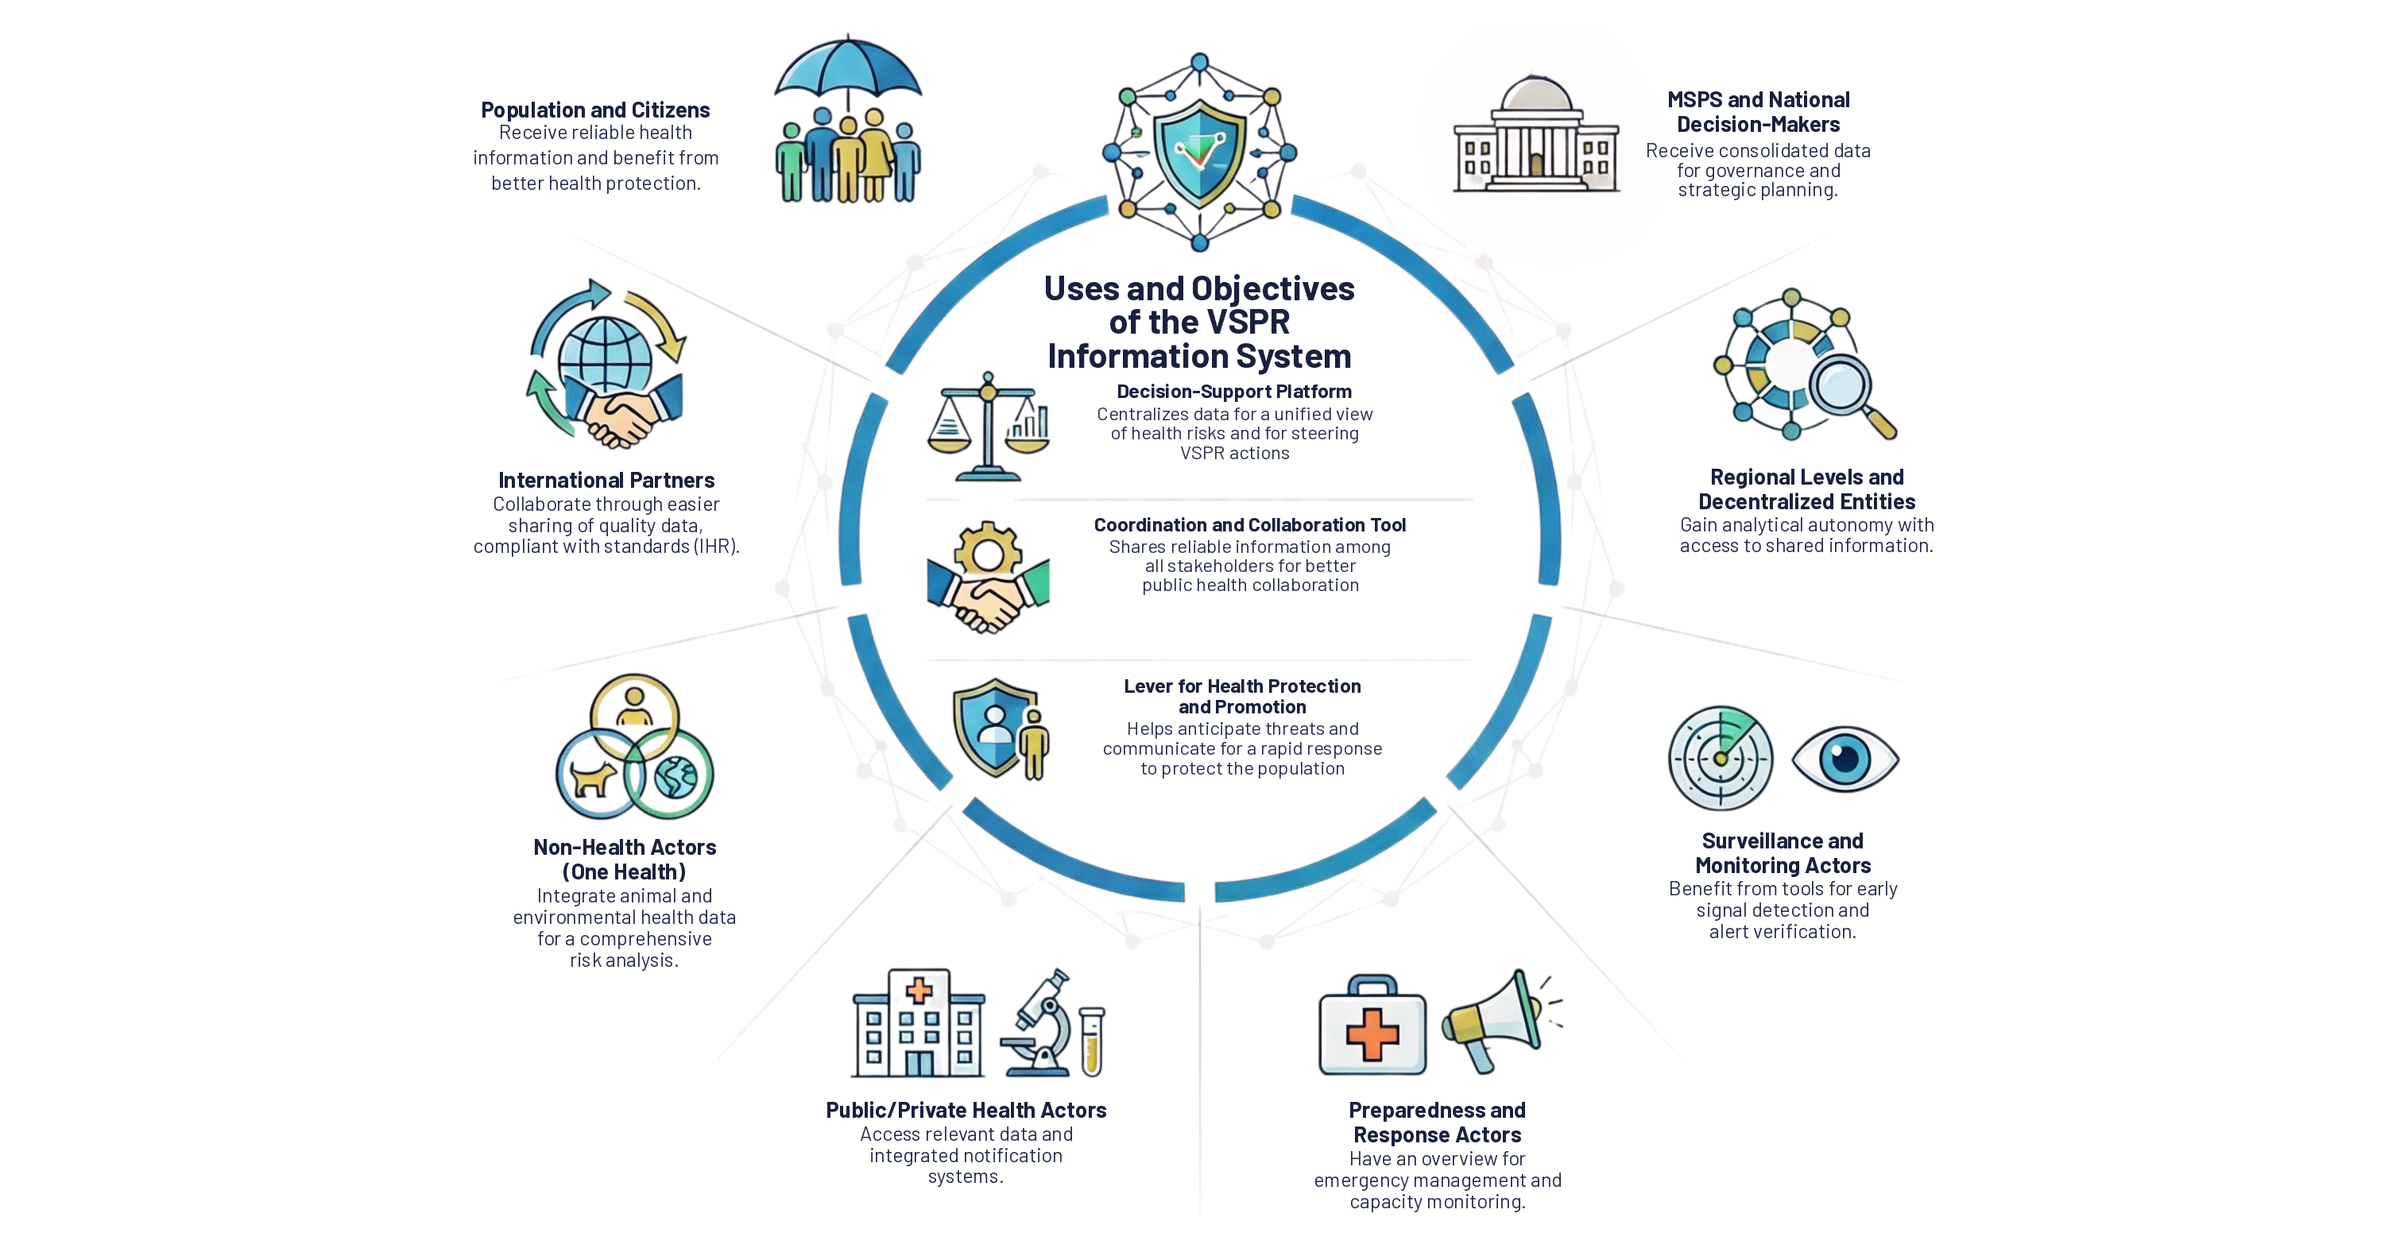
The response to epidemics depends as much on mobilizing expertise that shows up occasionally as on the existence of a system capable of producing, continuously and at the pace of events, information that is reliable, traceable, and usable. How do we move from fragmented notification to coordinated analysis? How do we make sure that every documented case, every laboratory result, and every alert contributes to a consolidated picture of the epidemiological situation?
Epidemiological data collection seems simple in theory. In reality, ministries of health and their partners face three major obstacles that slow down the response.
In most contexts, information flows through multiple, parallel channels. Paper forms are compiled manually. Laboratory results arrive late, through different and poorly coordinated channels. Case management data remains siloed from surveillance data. This fragmentation creates delays: every retranscription, every manual merge, every break in interoperability adds critical hours. And in an outbreak, every hour counts.
A patient with an infection is seen multiple times and in different settings. They may be identified in the community or at a health center, while their clinical assessment may take place elsewhere. Testing may happen at a laboratory hundreds of kilometers away. Medical follow-up, during treatment and recovery, extends over several weeks. Robust longitudinal follow-up requires being able to trace a suspected case from notification through biological confirmation, case management, and closure. Yet, without system interoperability, information about the same case becomes scattered: notification here, investigation there, laboratory result elsewhere. This makes it difficult to understand the transmission chain, slows down decisions about contacts, and complicates the evaluation of treatment effectiveness.
Without quality control mechanisms built into the workflow, inconsistencies accumulate. Fields are missing. Case definitions are not standardized across sites. Duplicates go undetected. The dashboards produced from this data reflect a degraded picture of reality, which undermines the credibility of the analysis and slows adoption by decision-makers.
Together, these three challenges point to one simple fact: without adequate infrastructure, the response runs on data that is fragmented, delayed, and of uncertain quality.
Faced with these challenges, one solution stands out: building a data integration architecture that combines three layers: structured collection, automated integration, and decision-oriented analytical products.
It all starts with data collection that is reliable and standardized. This means entrusting data entry to well-designed digital forms, not paper records. It means clearly defining case definitions, the steps of the follow-up process (notification, investigation, laboratory, case management), and the mandatory fields. A tool like DHIS2 Tracker offers exactly this capability: it structures the pathway of a suspected case, guides data entry, checks consistency, and creates a complete digital trail. This initial traceability is foundational: it lays the groundwork for everything that follows.
Once data is collected in a structured way, it needs to converge on a centralized data integration platform. Rather than relying on manual compilation, an infrastructure like OpenHEXA makes it possible to automatically link DHIS2 Tracker to laboratory data, case management registers, and other source systems. Documented data pipelines turn these disparate sources into consolidated, reproducible datasets. This automation eliminates the risk of error, speeds up the flow of information, and creates full traceability across the pipeline.
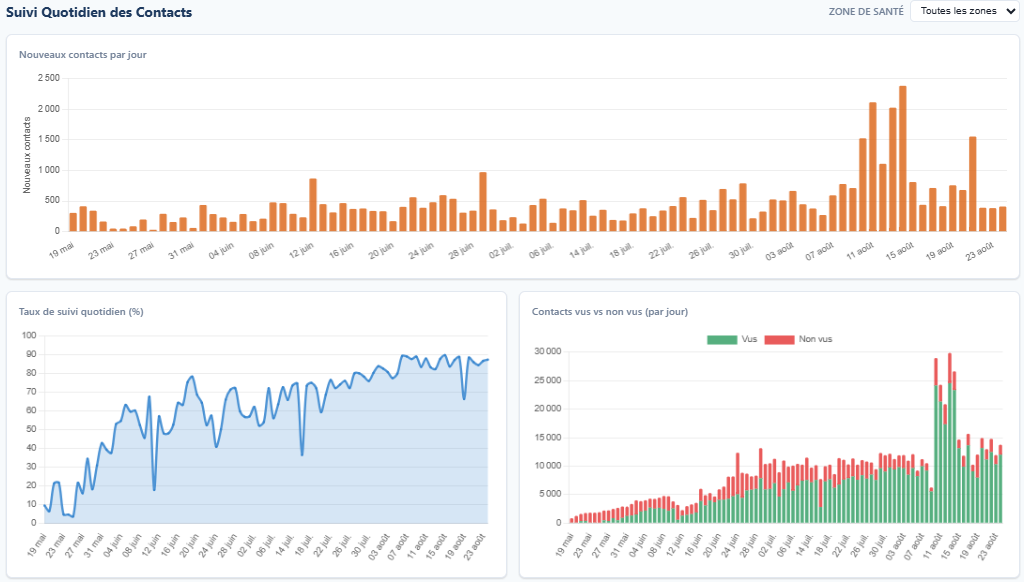
The final step is to turn this consolidated data into information that is directly useful for coordination and response. This takes several forms: epidemiological dashboards that visualize case distribution, trends over time, and warning signals in real time; validation and triangulation tools that allow the Public Health Emergency Operations Center to check consistency before dissemination; Situation Reports generated automatically every day for decision-makers. These tools turn raw data into operational intelligence. Bluesquare designs such data products in close collaboration with local surveillance teams, to ensure their operational usefulness.
To illustrate how this architecture works and can be replicated in different contexts, let’s look at two major deployments: in Burundi and in the Democratic Republic of the Congo.
In Burundi, the Public Health Emergency Operations Center (COUSP) and its partners have set up an infrastructure able to support the simultaneous surveillance of multiple diseases such as cholera, Mpox or COVID-19. DHIS2 Tracker structures longitudinal case follow-up, while OpenHEXA consolidates laboratory and operational data. The dashboards produced allow the COUSP to detect warning signals and coordinate the response in real time.
In the Democratic Republic of the Congo, the infrastructure takes on a broader scope. Beyond Mpox surveillance, the COUSP project (funded by the Gates Foundation and implemented with PATH) integrates a “One Health” approach: epidemiological, laboratory, climate, and environmental data converge in a unified intelligence platform. A shared geographic registry links the mapping of health facilities to epidemiological surveillance. The infrastructure, currently hosted by Bluesquare, is being migrated to a local solution managed by the Congolese government, strengthening digital sovereignty.
One last point sets this approach apart: it is not rigid. The architecture set up to support three priority diseases (cholera, Mpox, COVID-19) in Burundi was designed around a principle of modularity. It can be quickly adapted to cover other diseases such as Ebola. It can evolve according to national priorities. It can integrate additional sources. Its interoperability with the existing health information system also means that this surveillance infrastructure does not exist in a silo, but fits within a continuum: routine data, outbreak surveillance, response, and collective learning.
The real strength of such an infrastructure is not the solution itself, but the ability of the ministry of health and its partners to operate it, maintain it, adapt it, and evolve it. This is what we call data analytics for health system governance: data in service of better, faster decisions.
Building a resilient epidemiological surveillance system requires going beyond simply acquiring tools. It requires an architecture designed for integration, documented and reproducible processes, appropriate training, and clear data governance. The projects in Burundi and the DRC show that it is possible to turn fragmented surveillance into a coherent system able to support a fast, coordinated response, all while remaining interoperable with the broader health information system.
If you are looking to strengthen your epidemiological surveillance or prepare your system for a more effective response, this architecture can be replicated. Explore our integrated disease surveillance and response expertise to see how Bluesquare supports ministries of health in strengthening their surveillance and data analytics capacity.